InforShell
|
|
|
|
A novel spreadsheet for quick visual data trend analysis |

|
|
Introduction
The purpose of Trend View is to provide users with an efficient, visual and easy-to-use spreadsheet that can handle large amounts of data for:
In traditional spreadsheet approaches, to view data trends users will need to specify certain columns and rows to construct a graphic view on the data of interest, e.g. bar or line graphs. This process will be repeated for viewing a diagram for each data area individually. Taking a different approach, Trend View enables users to perform a mouse-driven data browse on the spreadsheet and visualized data (e.g line graphs, 3D plots) will be displayed accordingly. Additionally, in Trend View data values can be visualized by color indexing. Trend View can exchange data with MS-Excel and Matlab, and retrieve data from most commercial databases. Trend View can be used in many application areas where visual inspection of data trends is desirable, for example, scientific statistics, historical stock prices, environmental study, etc. |
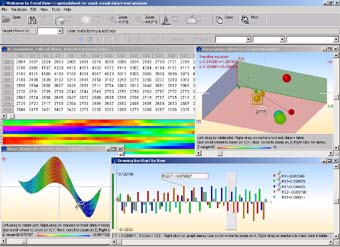 Figure 1. Trend View screen shot
Trend View download
| contact InforShell |
|
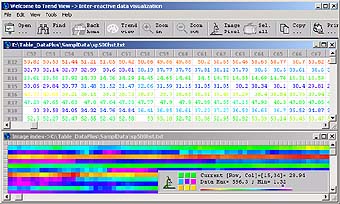
View data trend by color indexing
In addition to traditional spreadsheet functions, Trend View employs remote sensing data color-indexing techniques. To observe large data sets, users can specify color-indexing schemes to visualize data trends:
After color-indexing the spreadsheet, a global color-only view of the data is also generated. Each pixel of this color index image corresponds to a data value in the spreadsheet, at the row and column coordinate that matches the pixel's position. Using this feature, users can easily observe data trends by inspection. The color index image also serves as an interactive index: users can use the mouse to navigate on the image window, and the spreadsheet window will be driven to center on corresponding data automatically. Once users have identified regions of interest in the dataset, Trend View provides traditional features of line graph, bar graph, and 3D plot to facilitate data analysis. |
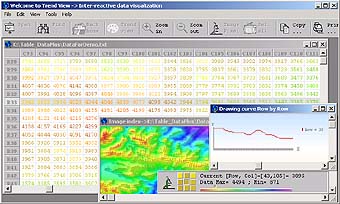 Figure 2. Data color indexing
|
|
Finding target values and the distribution
In Trend View, users can specify a value range to find and view results through a color indexing of target data values. Valid data ranges can be set to lower/higher than or equal/not equal to a specified value, as well as a range between upper and lower thresholds. The Find feature will produce a color index image, where values that are not in the target range are grayed out. The color index image enables the distribution of target data to be clearly viewed. It also allows visual trend analysis as well as interactive index to drive data browsing in the spreadsheet. (Details please see "View data trend by color indexing" section) |
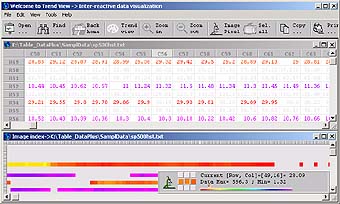 Figure 4. Finding target values and the distribution |
|
Data trend visualization
Graphical display functions, including 2D/3D line/bar graphs, are improved in Trend View by enabling the following interactive features:
|
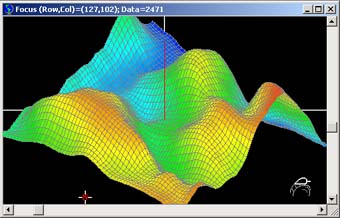 Figure 5. 3D visualization of data trends |
|
Data processing and calculation
Statistics:
Data processing:
Graph processing: |
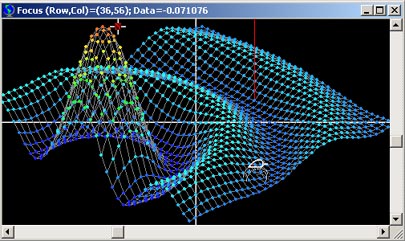 Figure 6. 3D visualization of data points |
|
File format and data exchange
Trend View can process up to 2000 rows and 1300 columns.
Output file
Data sharing
Data convert: |
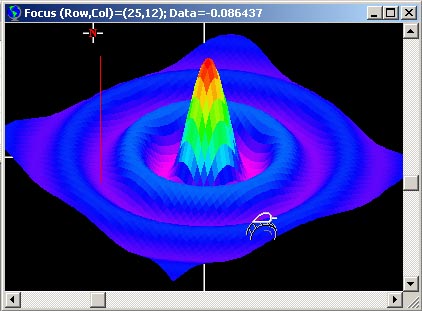 Figure 7. 3D visualization of Matlab exported data |