InforShell
|
|
|
|
Quick visual analysis of stock trends |
|
Historical stock prices format
Historical stock prices data can commonly be obtained in daily update format. The following fields are found in each record:
Data examples:
(These records have comma delimited fields, and each end with new lines.)
|
|
Reading historical prices - step 1
Select open mode Trend-View provides a specialized file input mode for historical stock data. To access this feature, go to the File menu, and select Open Stock History File Select data field delimiter Since data records may have been presented using a variety of different delimiting characters, Trend-View requires users to specify the correct delimiter. Users can use the "input file control" dialog box (automatically opened) to select/specify a delimiter.
|
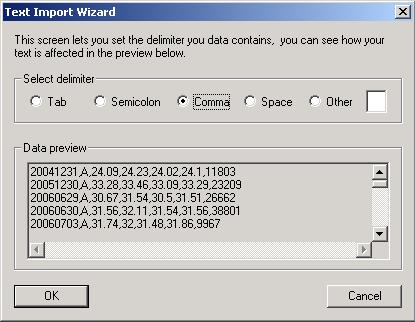 Figure 1. The "Text Import Wizard" dialog box |
|
Reading historical prices - step 2
Select field Trend-View will rearrange the stock prices data to facilitate analysis. The input data records will be indexed by company, and by date: each row contains all data for one company, and each column contains all data for one day. The values in each cell (for analysis) can be specified by the user to be one of the following:
For example, if the original data is:
Date, Company, Open, Day high, Day low, Close, Trading volume And user chooses to analyze "Day high" field, the Trend-View spreadsheet will open to show:
[Ticker symbol] [20061201] [20061204] [20061205] ...
Since various stock price sources may arrange the data fields differently, users need to specify which are the company name/ticker symbol, and date fields, as well as the field of interest for analysis (using the automatically opened dialog box).
|
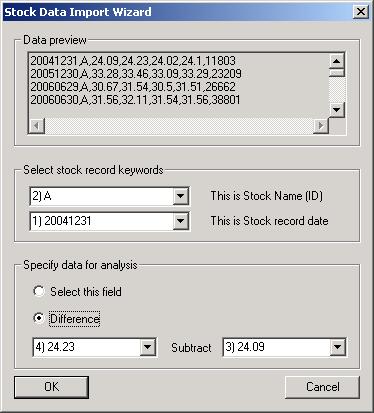 Figure 2. The "Stock Data Import Wizard" dialog box |
|
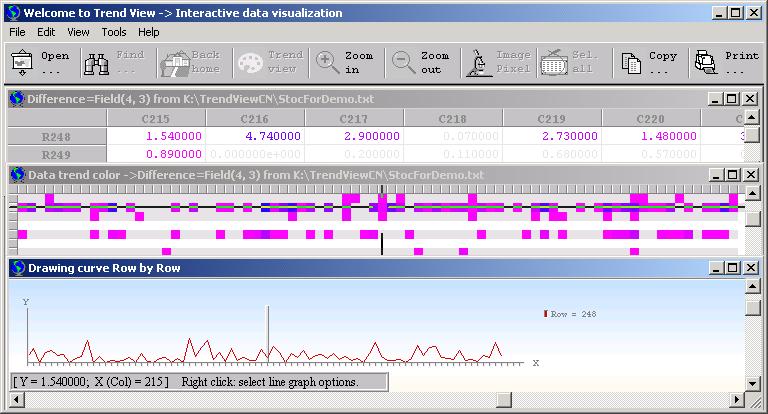
Investigating short term stock behavior
To look for stocks that exhibit significant price fluctuations on a daily basis, users can use the following procedure:
Observing data of interest Extra features in the spreadsheet, color-index image, and line graph windows: |
|
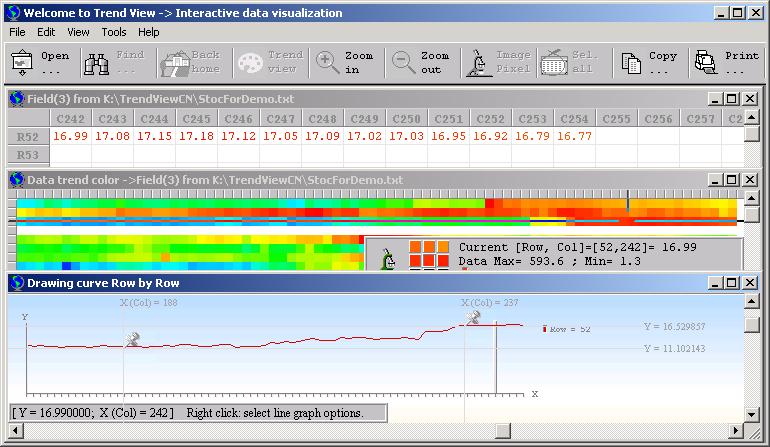
Investigating long-term stock behavior
To look for stocks that exhibit desired long-term growth, users can use the following procedure:
Observing data of interest Extra features in the spreadsheet, color-index image, and line graph windows: |